Material breakdown: Paper dominates – plastics remain the second-largest stream
The composition of packaging waste in the EU:
- Paper/Cardboard: 40.4%
- Plastics: 19.8%
- Glass: 18.8%
- Wood: 15.8%
- Metals: 4.9%
In 26 of the 27 EU Member States, paper/cardboard was also the largest waste stream in 2023. The only exception was Bulgaria (2022), where plastics were marginally higher.
The range for plastics varies significantly:
from 16.0% in Luxembourg to 29.8% in Ireland.
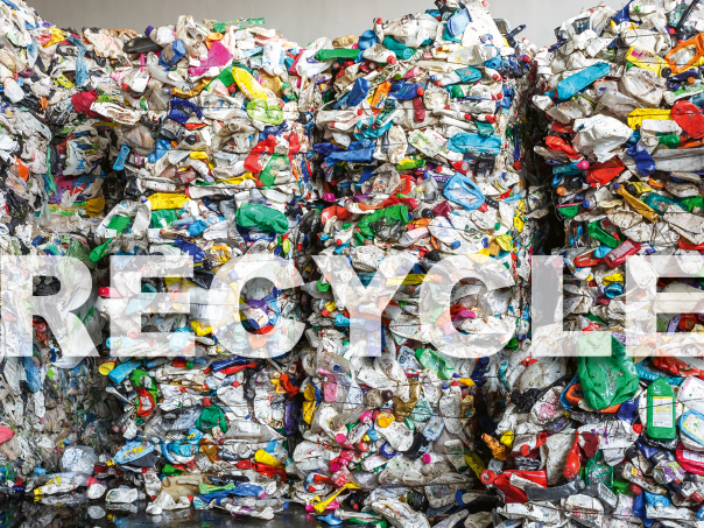
Recycling rates: 7 countries have already met the 2030 targets
The EU achieved a weighted average recycling rate of 67.5% in 2023 – just below the 70% target for 2030. Seven countries already meet or exceed the 70% target:
- Belgium (79.7%)
- Netherlands (75.8%)
- Italy (75.6%)
- Czechia (74.8%)
- Slovenia (73.6%)
- Slovakia (71.9%)
- Spain (70.5%)
Other countries, including Germany, France, Sweden and Estonia, are approaching the target, achieving between 68.5% and 69.5%.
At the lower end:
- Romania (37.3%; 2022)
- Hungary (42.8%)
- Malta (44.4%)
- Greece (48.0%)
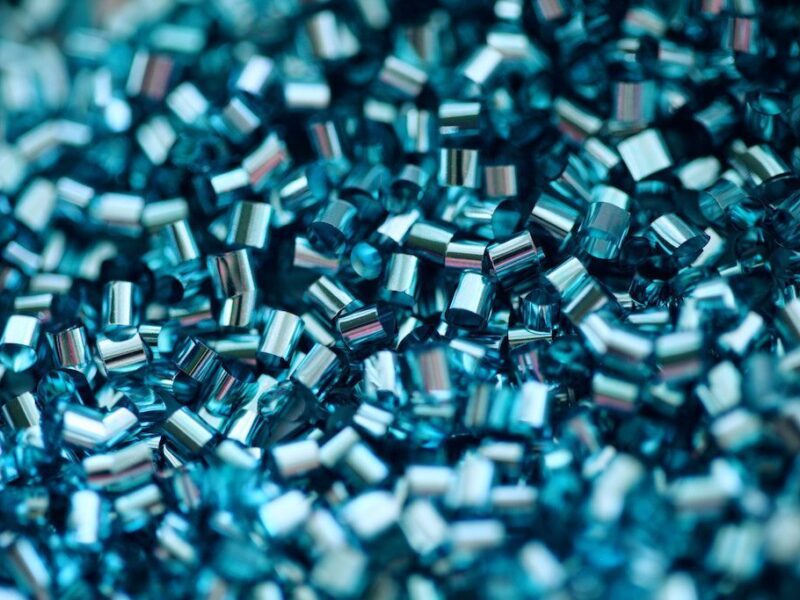
Plastic packaging: Only Belgium and Latvia exceed the 2030 target
The challenge in plastic recycling becomes particularly apparent:
- 2030 target: 55% recycling
- Only Belgium (59.5%) and Latvia (59.2%) exceed the target
- Germany (52.2%), Slovakia (54.1%) and Czechia (52.4%) fall just short
- Eight countries remain significantly below 30%, including France, Austria, Croatia, Denmark and Hungary
This spread highlights the substantial differences in infrastructure, sorting performance, and market mechanisms across Europe.
Plastic bags: EU-wide decline since 2018
In 2023, each person in the EU consumed an average of 65 lightweight plastic carrier bags – 30 fewer than in 2018. Nine countries are already below the target of fewer than 40 bags by 2025, including:
- Belgium (4)
- Poland (7)
- Austria & Portugal (14)
- Germany & Netherlands (31)
The largest reductions since 2018 were recorded in:
- Sweden (-131 bags)
- Lithuania (-125)
- Latvia (-118)
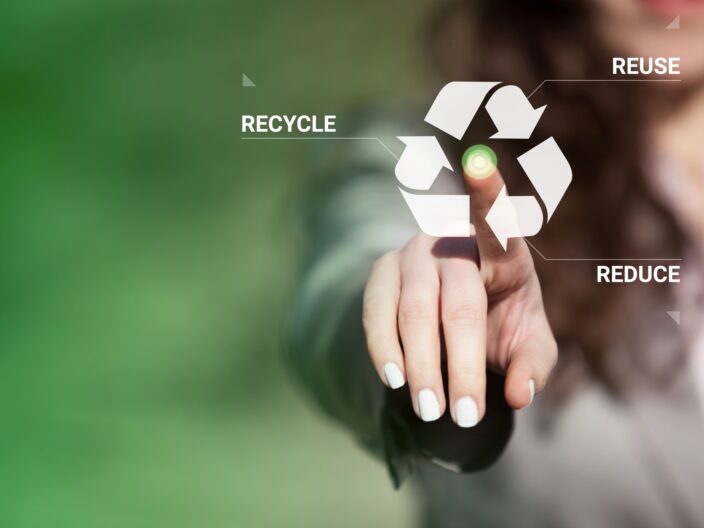
What do these developments mean for the circular economy?
The data presents a mixed picture:
1. Progress is visible – but unevenly distributed
Some countries operate at a level well above EU minimum requirements. Others lag far behind, particularly where:
- sorting quality is low
- raw material markets are volatile
- recyclates are insufficiently demanded or used
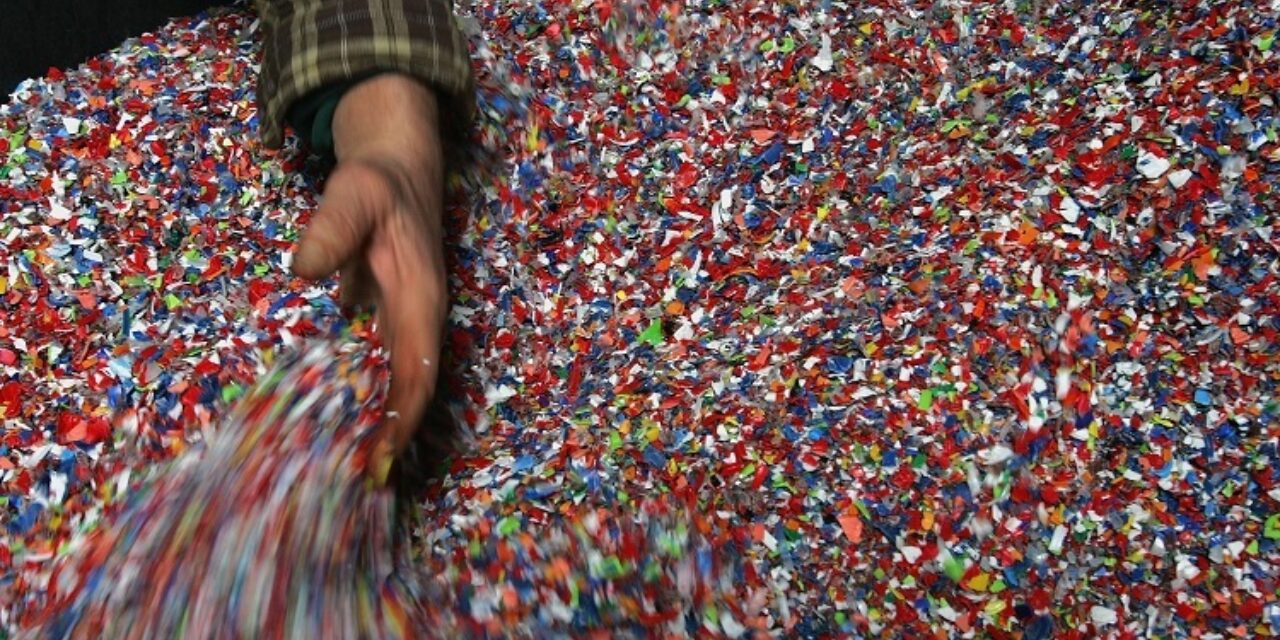
2. Plastics remain the bottleneck material
While paper, glass and metals operate in relatively stable cycles, plastics depend heavily on:
- material quality
- visibility of material flows
- technical sorting capabilities
- market access for high-quality recyclates
3. Data structures are becoming increasingly crucial
A key insight from the Eurostat figures is the rising importance of:
- quality-assured material data
- industry-wide standards
- digital links along the value chain
- transparency on quantities and quality
Digital platform approaches such as those offered by plastship help harmonise data and strengthen networking across the value chain. They support greater transparency of material flows and provide structured information on quality, processing and recycling potential.